

A diode can stop conducting forward current and still force the switching circuit to handle stored charge. Fast recovery diode reverse recovery charge Qrr measurement captures the charge that flows in reverse during turn-off, while reverse-recovery time is the sum of ta and tb. Together, these values show how the diode behaves during a switching transition.
Qrr and recovery time matter because they influence current and voltage stress, switching losses, and diode selection in a power design. To measure them accurately, capture the reverse-current waveform under defined test conditions and calculate the area beneath its recovery portion. This guide explains the measurement, the factors that affect its result, and how Qrr contributes to switching losses. It also describes how stored minority carriers shape recovery in pn-junction diodes, helping you interpret datasheet figures in the context of your circuit rather than as isolated values.
Key Takeaways
- Learn how to interpret reverse-current waveforms and distinguish recovery intervals when comparing diode data.
- See why forward conduction time, current conditions, and carrier lifetime can change measured recovery behavior.
- Understand how minority carriers build up and release in pn-junction diodes, and why that matters during switching.
- Identify the test-circuit and measurement equipment needed to capture recovery behavior under controlled conditions.
- Connect diode recovery characteristics to switching losses and make more informed component choices for power designs.
Definition of diode reverse recovery time
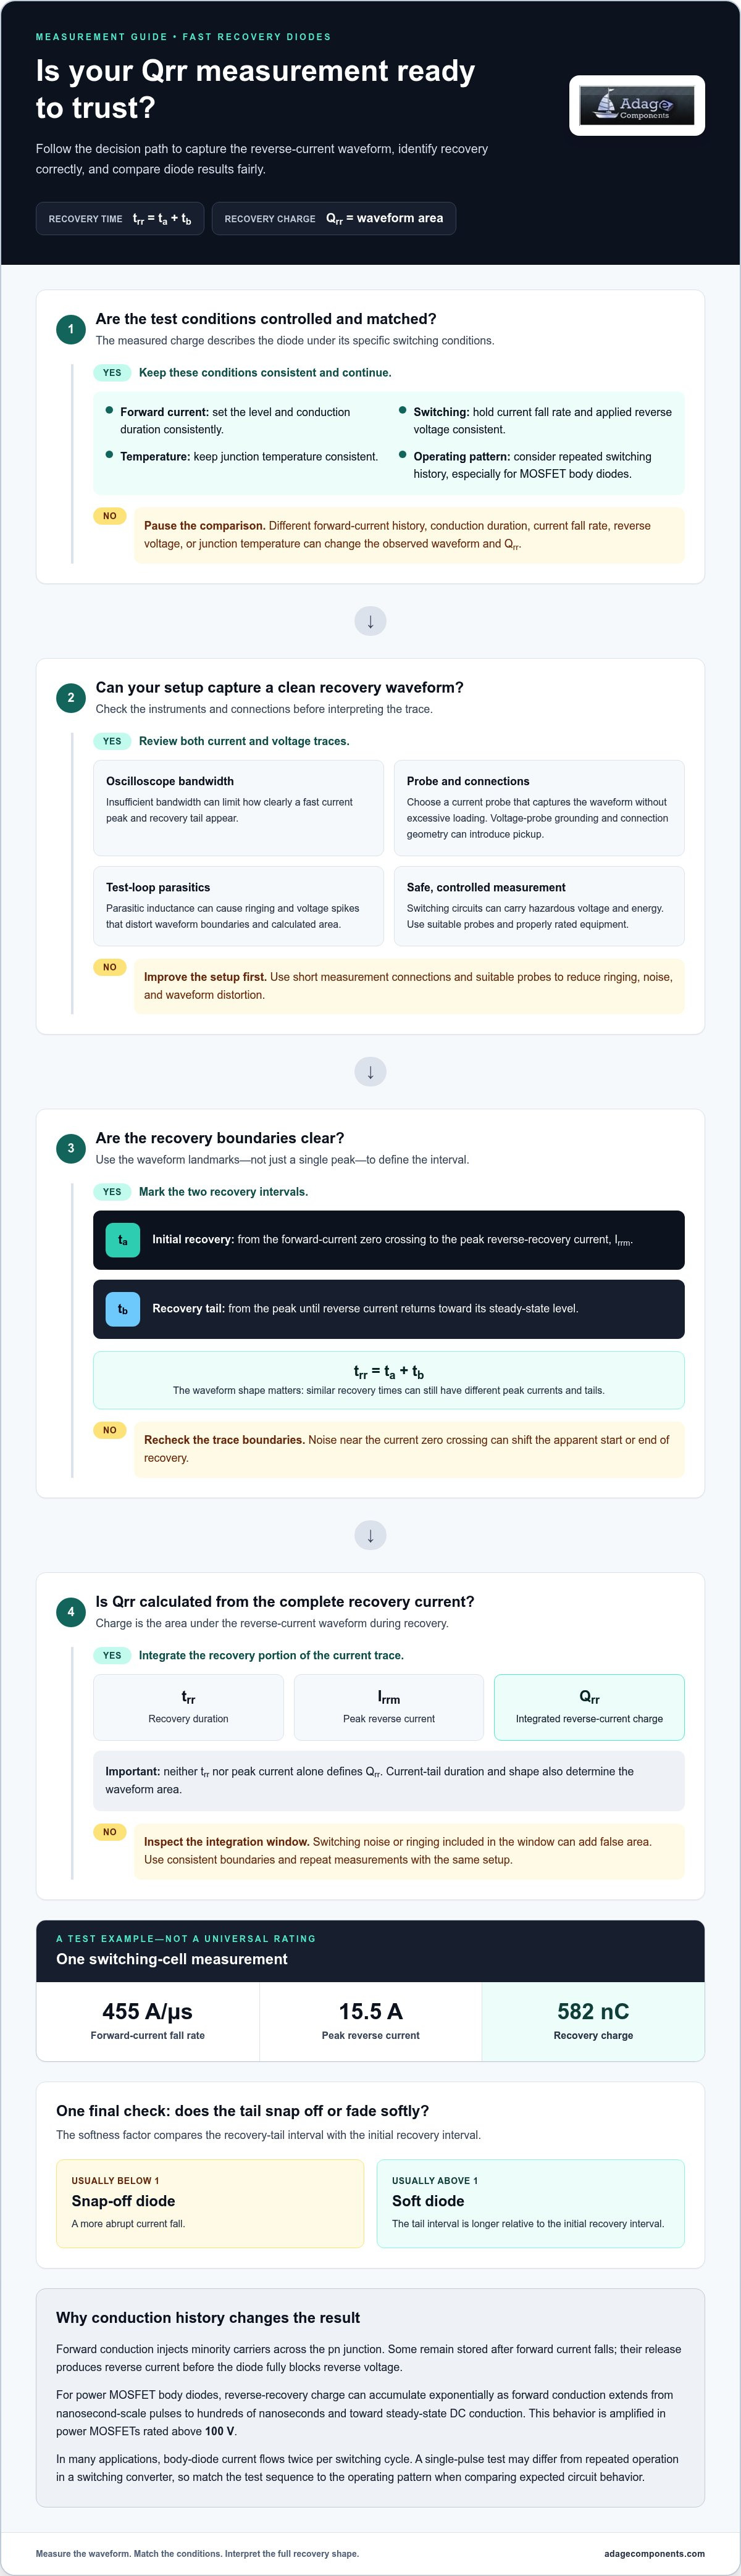
A pn-junction diode does not stop conducting instantly when its forward current falls to zero. Stored minority carriers continue to flow as reverse current, creating a recovery interval before the diode blocks reverse voltage. Reverse recovery time, written as trr, measures this interval. In the application-note definition, trr = ta + tb.
On an oscilloscope trace, ta runs from the forward-current zero crossing to the peak reverse-recovery current, Irrm. tb covers the remaining recovery tail, until reverse current returns toward its steady-state level. The waveform shape matters: two diodes can have similar recovery times but different current peaks and tails.
To see reverse recovery and stored charge demonstrated on an oscilloscope, watch this tutorial from w2aew:
Reverse-recovery charge, Qrr, is the area under the reverse-current waveform during recovery. It represents the charge that must leave the diode before it establishes its reverse-blocking state. A higher peak current does not necessarily mean a higher charge: the current tail’s duration and shape also determine the waveform’s area.
How do trr and Irrm relate to Qrr? trr describes the recovery duration, and Irrm is the peak reverse current. Qrr integrates reverse current over time. Assess charge using the complete waveform, since neither recovery time nor peak current alone defines its area.
Compare measurements only when the test conditions match. Forward current before switching, its rate of fall, applied reverse voltage, and junction temperature can change the observed trace. In a switching-cell example, a forward-current fall rate of 455 A/μs coincides with a 15.5 A peak and 582 nC of recovery charge. Those values describe that test example, not a universal diode rating.
The recovery tail also describes how abruptly current falls. The softness factor compares the tail interval with the initial recovery interval: a snap-off diode usually has a factor below 1, while a soft diode usually has a factor above 1. That shape can help explain switching behavior beyond the single trr figure.
What are common errors and safety risks when measuring fast recovery? Common errors include inconsistent test conditions, incorrectly identifying waveform boundaries, and integrating switching noise as recovery current. Switching circuits can carry hazardous voltage and energy. Use suitable probes, properly rated equipment, and controlled measurement practices.
Factors affecting reverse recovery
Reverse-recovery measurements depend on the diode’s electrical history and switching conditions. Forward current establishes stored charge before turn-off; its magnitude, conduction duration, and rate of change shape the reverse-current waveform. A measured Qrr therefore describes the diode under particular test conditions, not a property independent of its circuit.
Conduction duration is especially important for power MOSFET body diodes. Their reverse-recovery charge can accumulate exponentially as forward conduction extends from nanosecond-scale pulses to hundreds of nanoseconds, then toward steady-state DC conduction. This time-dependent behavior is amplified in power MOSFETs rated above 100 V. The device’s minority-carrier lifetime governs the accumulation, so measurements taken after different conduction periods may produce different results.
The measurement setup also affects the result. Oscilloscope bandwidth can limit how clearly it captures a fast current peak and recovery tail. Probe choice affects signal fidelity: a current probe must capture the relevant waveform without excessive loading, while voltage-probe grounding and connection geometry can introduce unwanted pickup. Parasitic inductance in the test loop can cause ringing and voltage spikes, distorting waveform boundaries and the calculated area.
To improve measurement accuracy, control these conditions across comparisons:
- Set the forward-current level and conduction duration consistently before each switching event.
- Keep the current fall rate, reverse voltage, and junction temperature consistent when comparing devices.
- Use short measurement connections and suitable probes to reduce ringing, noise, and waveform distortion.
In a MOSFET body diode, repeated switching can affect the stored charge. In most applications, current flows through the body diode twice per switching cycle, allowing charge to build up. A single-pulse test may therefore differ from operation in a switching converter, where conduction history repeats. Match the test sequence to the operating pattern when you want to compare expected circuit behavior.
Distinguish diode behavior from instrument artifacts. Noise near the current zero crossing can shift the apparent start or end of recovery. Including ringing in the integration window can add false waveform area. Review both current and voltage traces, use consistent waveform boundaries, and repeat measurements with the same setup before comparing results.
For component selection, connect recovery requirements with the diode category and circuit role. The diode product linecard can help relate available diode types to your design’s switching needs.
Minority-carrier storage and release
In a pn-junction diode, forward conduction injects minority carriers across the junction. Some remain stored in the semiconductor after the forward current falls. When the diode switches from on to off, those carriers must be released before the junction fully blocks reverse voltage. Their removal produces reverse current, contributing to the measured recovery charge and shaping the current waveform.
Stored charge depends on the diode’s conduction history and semiconductor properties. During forward bias, carrier injection establishes a concentration profile through the junction and drift region. Reverse bias then sweeps carriers out or allows them to recombine. The time needed to clear this charge determines how long the diode continues conducting in reverse. A longer-lived carrier population can produce a broader recovery waveform.
Fast recovery diodes and high-efficiency rectifier diodes use methods to reduce carrier storage. Heavy metals such as platinum are introduced into the drift region, creating crystal defects that trap minority carriers under reverse bias. This process shortens reverse recovery time by reducing the population available for release during turn-off. The design trades carrier lifetime against recovery behavior, so the resulting waveform reflects the diode’s semiconductor construction.
Power MOSFET body diodes show a related dependence on minority-carrier lifetime. Their reverse-recovery charge saturates when the forward-conduction period exceeds approximately three minority-carrier-lifetime time constants. Before saturation, longer conduction allows charge to accumulate; beyond that point, additional conduction adds little stored charge. This matters when a test pulse represents only a brief interval, but the body diode conducts longer in the actual circuit.
Use the carrier-storage model to interpret a measurement:
- Identify whether the device is a pn-junction diode or a MOSFET body diode, because their structures differ.
- Record the forward-conduction history before switching, since it affects the stored carrier population.
- Compare recovery traces under matching conditions, then relate differences to carrier lifetime and diode construction.
For example, a platinum-treated fast recovery diode can release fewer stored minority carriers during turn-off than a conventional diode with a longer carrier lifetime. This can shorten its reverse-current tail, but the measured charge still depends on test conditions. Interpreting Qrr alongside diode structure helps distinguish a device characteristic from a result caused by a different conduction history.
The measured charge also depends on how the diode was driven and how much charge was stored at switching. In a pn-junction diode, stored carriers must be released as the diode transitions from on to off. The reverse-current response is tied to that release, so interpret the waveform in light of the preceding conduction history rather than as a stand-alone measure of one material feature.
For a power MOSFET body diode, the device’s minority-carrier lifetime governs the exponential accumulation of reverse-recovery charge. Comparisons are most useful when forward-conduction histories match; otherwise, charge differences may reflect differences in carrier accumulation. Relating each recovery trace to lifetime and stored charge connects the observed response to the device’s operating history.
Qrr impact on efficiency
Reverse-recovery charge affects efficiency because the switching transistor must remove stored diode charge during commutation. This adds current and energy to the switching event. The resulting loss depends on the circuit’s operating voltage, current, switching frequency, and diode waveform. A lower Qrr can reduce this contribution, but it does not determine total converter efficiency by itself.
For a useful estimate, relate switching energy per event to switching frequency: average switching power is event energy multiplied by events per second. This makes even modest energy differences relevant when switching repeats frequently. In an application-note example operating at 30 kHz, theoretical and measured power losses differed by approximately 1 W, or approximately 10%. The example illustrates why waveform-based energy measurement can matter more than relying on a simplified estimate alone.
Measured energy examples also show how diode choice changes transistor switching burden. With an ultrafast diode, total MOSFET turn-on energy measured 219 μJ; with a SiC diode, it measured 55 μJ. In a separate energy-measurement example, MOSFET turn-on energy attributable to the ultrafast diode was 164 μJ. The examples use different reported measures, so don’t treat them as interchangeable values or universal device ratings.
Diode turn-off contributes energy too. One application-note example reports 327 μJ total switching energy attributable to diode turn-off. Another switching-cell example calculates diode-related switching energy at 363 μJ and measures ultrafast-diode turn-off energy at 163 μJ. Each value reflects its own circuit and measurement method. Comparing them requires matching the energy definition, switching conditions, and components.
Higher Qrr can also worsen voltage stress, which may affect efficiency and design margins. In a simulation for a specific transistor and application at a 5 A load current, doubling Qrr reduced efficiency by 5%. A separate simulation using the same 5 A load-current condition found that doubling Qrr increased voltage spiking by 8%. These results describe that specific simulation, not a general prediction for every converter.
- Compare diode candidates using switching-energy measurements from equivalent circuit conditions.
- Include both diode recovery and transistor turn-on energy when assessing switching loss.
- Check voltage waveforms alongside efficiency, because recovery current can contribute to voltage spiking.
Use Qrr as one input in a complete loss assessment. Pair it with measured switching energy and operating frequency to evaluate the diode’s practical effect on converter efficiency.
What test circuit and equipment are needed to measure diode Qrr?
A controlled switching circuit must drive the diode from forward conduction into reverse bias while capturing its current waveform. A common arrangement uses a DC supply, an inductor, a switching MOSFET, a gate driver, and the diode under test. The inductor establishes forward current; turning on the MOSFET commutates that current and drives the diode into recovery. The circuit must also provide a defined reverse-voltage condition.
Measurement equipment records the switching event without materially disturbing it. Use an oscilloscope to capture diode current and, when needed, the voltage across the diode or switching device. A current probe or low-inductance current shunt measures current. A differential voltage probe captures the voltage waveform without relying on a long ground lead. Keep probe connections short because the test loop and measurement setup can add parasitic inductance.
Prepare the capture around the waveform you need to evaluate:
- Connect the current measurement in the diode’s current path, with polarity set to distinguish forward from reverse current.
- Use a voltage measurement across the diode or switching node to identify the transition into reverse bias.
- Trigger the oscilloscope from the switching control signal or a repeatable waveform edge.
- Capture enough of the trace to include the forward-current transition, reverse-current peak, and recovery tail.
- Set the integration window to cover recovery current, excluding unrelated ringing and baseline noise.
Calculate Qrr by integrating reverse current over the defined recovery interval. The oscilloscope’s math function can integrate a captured trace, or you can process exported waveform data separately. Confirm current polarity and baseline before integration. A baseline offset across the interval adds false area, while a window that cuts off the tail understates the charge.
Repeat the capture under the same forward current, conduction history, current fall rate, reverse voltage, and temperature when comparing diodes. Keep the fixture layout unchanged, too. Moving the diode or shunt, for example, can alter loop inductance and waveform ringing, even if circuit settings remain fixed. Save the waveform alongside the test conditions so the calculated charge remains traceable to its setup.
Before energizing the circuit, inspect probe connections, component orientation, and the MOSFET gate-drive path. Switching tests can expose the operator and instruments to hazardous voltage and stored energy. Use equipment and probes rated for the circuit, and keep exposed conductors isolated during operation.
Once the test method is defined, compare diode options against the circuit’s recovery requirements. Review diode options on the linecard to support component selection for your switching design.
Adage Components: Thick Film Chip Resistors
Adage Components offers Thick Film Chip Resistors, Thin Film Precision Resistors, Carbon Film Resistors, and MELF Resistors for your component sourcing needs. We provide manufacturer pricing and OEM pricing, with cost-effective options for OEMs and EMS providers. Our international logistics and short lead times help support your supply requirements.
We focus on authentic components sourced through direct, verified procurement channels. For resistor requirements alongside diode evaluation, contact Adage Components to discuss your needs.
Turn measurement results into a design decision
Use Qrr results to set a component acceptance criterion for the actual operating envelope, not just for a laboratory comparison. Document the test setup, waveform-processing method, and conditions alongside each result. This gives engineering and procurement teams a consistent basis for evaluating substitutions during design updates or sourcing changes.
Measuring a fast recovery diode’s reverse recovery charge, Qrr, is most useful when the result is tied to the switching stage’s requirements. Decide which trade-offs matter for your application, then carry those criteria into component evaluation and BOM planning. This keeps electrical performance and sourcing decisions aligned as designs move toward production.
For your broader component planning, explore Adage Components’ electronic component linecard. Apply a repeatable evaluation process, and move forward with a clearer basis for your next design decision.
Frequently Asked Questions
What Is Reverse Recovery in Power Semiconductors?
Reverse recovery is the brief reverse-current flow that occurs as a conducting pn-junction diode switches to its off state. Stored minority carriers must leave or recombine before the junction blocks reverse voltage. This behavior can affect a MOSFET’s turn-on waveform during commutation. Silicon and SiC Schottky barrier diodes are unipolar devices, so they have virtually zero reverse recovery time.
How is diode reverse recovery charge Qrr measured using a double-pulse test?
A double-pulse test supports fast recovery diode reverse recovery charge Qrr measurement by establishing inductor current, then commutating it through the diode under test. Capture the reverse-current waveform with an oscilloscope and suitable current probe or shunt. Integrate its recovery portion to calculate Qrr. For repeatable fast recovery diode reverse recovery charge Qrr measurement, record and match the current, voltage, conduction history, and temperature conditions.
How does diode Qrr vary with forward current, commutation rate, reverse voltage, and junction temperature?
Forward current and conduction history affect the stored charge before turn-off, while commutation rate shapes the reverse-current peak and waveform. Reverse voltage and junction temperature also influence the measurement. Their effects depend on diode construction and test conditions, so compare values only under matched conditions. A result measured at one junction temperature, for example, should not be treated as directly equivalent to one measured at another.
How does Qrr measurement differ for Si fast recovery diodes, ultrafast diodes, and SiC Schottky diodes?
For silicon fast-recovery and ultrafast diodes, measure Qrr by integrating the reverse-current waveform during recovery. Stored minority carriers produce the recovery current, and carrier lifetime and test conditions affect the result. A SiC Schottky diode is unipolar and has virtually zero reverse-recovery time, so its recovery charge is virtually zero.
Disclaimer
Cross-referenced components needs to be confirmed by the client with either spec. sheet or samples or both.
Please note, we use AI to help us, information is verified to be correct but we can not guarantee 100% accuracy.


